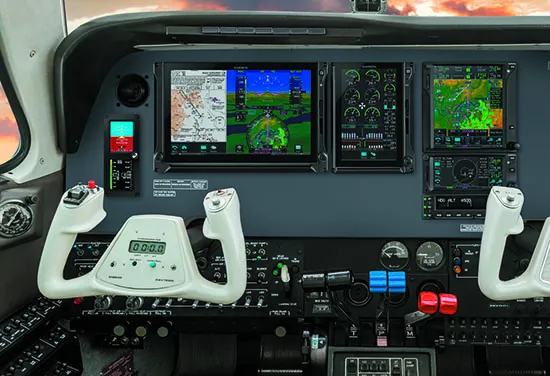
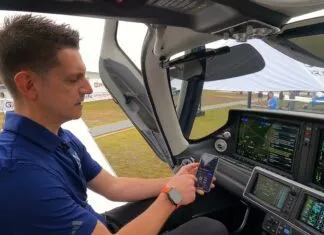
Part of the challenge that has always tagged along with standalone engine monitor installations is placing the control head in a useful location on the panel. Since engine and fuel data is critical, you really want the monitor in your primary scan. While that may be easier with smaller displays, it means major panel rework for larger systems.
Garmin’s Engine Indication System, or EIS, worked we’ll in the G3X series for experimentals. For the certified world, its compatibility with a variety of Garmin retrofit displays opens the interface to a wide variety of panels and budgets. Still, planning an EIS retrofit can be tricky, especially if you haven’t decided on a display configuration. Here’s a primer to help with the planning.

WHO NEEDS IT?
Face it, the OEM engine and fuel gauges in many aging aircraft are getting tired. And even if they’ve been supplemented by an aftermarket standalone engine monitor, the display may not be in the best spot on the panel, and it may not play all the data you want including RPM, manifold pressure and fuel quantity, to name a few features.
On the other hand, if the aircraft already has a big-screen primary engine and fuel display (the good-performing JP Instruments EDM930 and Electronics International MVP-series displays come to mind), we don’t see many reasons to rip them out in favor of Garmin’s EIS—especially if the aircraft already has glass flight instruments.
BIG-SCREEN TXI
To keep this article contained, we’ll describe most of the EIS functions using the G500 TXi retrofit display as an example. Keep in mind that a Garmin EIS is essentially the same whether it’s displayed on a TXi, a G3X Touch or on a smaller-sized
GI 275. But your choice of displays is important, and comes down to budget and panel real estate. It also depends on whether you want a full-screen engine display.
If transitioning to electronic primary instruments with Garmin’s G500/600 TXi or G3X Touch is your plan, we think the EIS add-on is a worthy (and complex) interface. EIS isn’t a supplementary system—the shop will pull all the old stuff out.
That’s because the EIS is approved for displaying primary engine and fuel data, where the interface is blanketed under the display’s AML-STC. The G500/600 TXi is the big-screen PFD/MFD replacement for the original G500/600 displays, and no, the EIS won’t work on these older units—it has to be a TXi. When installed per the STC, there’s no requirement for a backup display, and the data fits fine on one screen. Shops tell us that some buyers elect to retain the existing tachometer(s), but for the most part, the installation includes gutting the existing OEM gauges—including the fuel indicators.
Engine, fuel and electrical data for the EIS goes through Garmin‘s $2650 GEA 110 engine interface adapter module. This is a remote box that mounts to the rear of the 10-inch GDU 1060 TXi display, or it’s remotely mounted. Twin-engine aircraft require two GEA 110 units. The install kits have just about everything to complete the install, but there might be some optional components to purchase, and this is where you’ll need to rely on the shop to help build the right package.
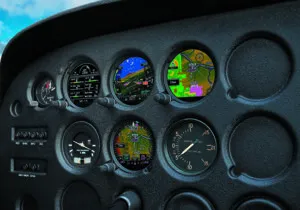
For example, one experienced Garmin dealer—Sarasota Avionics in Florida—helps plan the job with a good installation worksheet to properly spec out a given system’s sensors (a sensor package is required for each engine being monitored). It starts with selecting optional displays and sensor packages you want. The base four-cylinder sensor kit with CHT, EGT and oil pressure sensor is $639, while the kit with oil temperature and fuel flow for engines with a fuel pump is $999, and slightly more for gravity-fed fuel systems. There are also sensors for manifold pressure, fuel pressure and turbine inlet temperature for turbocharged engines. There are options for various tach senders, depending on the type of mags that are on the engine. The EIS works with electronic ignitions, too.
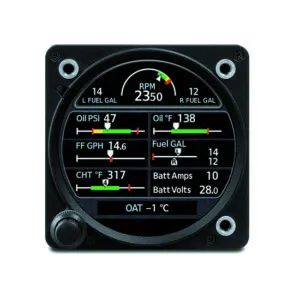
Sensors aside, on the TXi/G3X Touch, engine and fuel data is displayed in strip format. The data can also be displayed on an optional standalone 7-inch portrait display, priced at $9395 for Class 1 and Class II piston singles and twins. There are also applications for select turbines. Additionally, depending on panel space, there’s also an option for a landscape-configured 7-inch EIS display—lots of choices.
As for engines, the EIS is compatible with most normally aspirated and turbocharged Lycoming and Continental four- to six-cylinder engines, and the six-cylinder version EIS is $300 extra, putting the 7-inch TXi dedicated display configuration at $9695. It’s a hefty price to pay for being able to spread all of that engine and fuel data out on a dedicated full-time display, rather than the stock strip display on the TXi PFD/MFD. The strip format is always in view on the main TXi display, of course. There’s also a pilot-selectable engine data page on the MFD.
Still, whether you choose the optional dedicated display or not, we think the EIS displayed data is we’ll executed and logical—enabling precise aircraft-specific configuration of fuel, electrical and engine temp thresholds and such.
Saying that, the accuracy of the initial setup is critical, especially calibrating the fuel quantity functions. That’s why we think it’s important to take it to a shop that has experience installing the system and in particular, knows how to properly configure it. There’s also the skill required to work on the engine. As one example, the “dynamic gauge” feature relies on the installer to configure specific aircraft/engine data properly, and much of that data comes from the aircraft flight manual and supplements. It’s the owner’s responsibility to provide the shop with accurate data, especially if there are engine and fuel system mods in place.
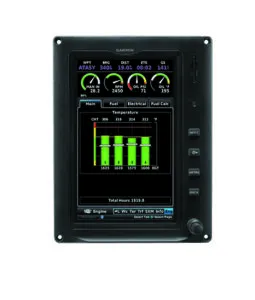
DIGITAL LOGIC
As for presentation, we think Garmin nailed the ergos. The EIS displays a graphical presentation and a digital display of a specified value, plus a dynamic readout from the associated sensor. Bar graphs provide digital EGT/CHT and TIT (when equipped) cylinder readings and these values are selectable by cylinder. After 10 seconds, CHT values will default to the hottest cylinder on each engine being monitored.
For twins, Garmin did a good job displaying prop sync, providing the familiar standard reference indicator, but in digital format. It simply uses the pick-offs from each engine’s tachometer to show a comparison of the matched RPM and the propeller phase angles between the two engines. Simple—the indicator is stationary when both props are in sync—and the indicator rotates in the direction of the faster engine, just as it does with a mechanical prop sync indicator.
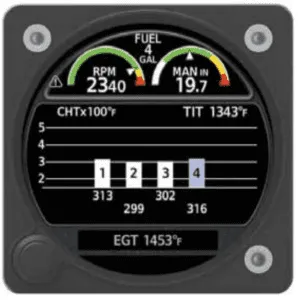
For alerting purposes, the EIS engine gauges are split into two groups: engine power and engine performance. Alerting functions differ for each group. To alert the pilot, engine gauges change appearance when a parameter is within a caution or warning alert band. Alerting range indications remain active while the gauge is within the alerted range.
As an example, for the gauges in the engine power group (manifold pressure, RPM and fuel flow), the electronic pointers change color to reflect non-safe operating status and the digital readout turns red (or amber) depending on the alert type. For gauges in the engine performance group (oil pressure, oil temp, fuel quantity and pressure, CHT and amps/volts), the pointer changes color and the gauge label, readout field and units will flash amber or red. Much like a CAS (and as it does on Garmin’s G-series integrated avionics suites), all flashing indications turn solid once the pilot acknowledges the alert. To minimize the number of nuisance alerts, oil pressure gauges do not flash when within the caution band.
Standard on the EIS is the Lean Assist utility—something that’s been a major and welcomed feature on Garmin’s integrated flight decks. Tapping the dedicated Lean softkey places the EIS in Lean Assist mode. When the mode is active, the EGT bar graphs won’t be active and you don’t have access to the system’s Engine menu. But it’s about as intuitive as it gets. During Lean Assist mode, the system waits for the EGT (or TIT on a turbo) to peak, and then decrease by a minimum of 60 degrees. When this occurs, the corresponding temperature bar on the graph turns white and a white saddle indicates the maximum temperature value recorded for the sensor. In cases where the system waits for the last engine cylinder to peak, violet saddles indicate the maximum temperature of all other peaked cylinders.
The Peak annunciation and temperature value display in white at the top of the graph. After three seconds, this field reverts to the current operating temperature. A numeric field displays the difference between the peak and current operating temperatures. This value changes to reflect all subsequent temperature fluctuations. A negative value denotes an operating temperature lower than the maximum recorded value. A positive value denotes a temperature increase greater than the previously detected peak. Also, the saddle position and deviation values automatically adjust to reflect any increases in peak temperature.
A FEW WORDS ON FUEL SENDERS
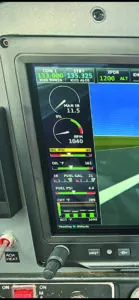
Garmin’s EIS has primary fuel quantity indication, and the existing analog fuel gauges can be removed. While this may make buyers jump for joy to finally get out of the world of bouncing, unreliable fuel gauges, shortcuts can create their own problems. Have your shop make an accurate assessment of the fuel senders in the aircraft. There are several types (resistive and capacitive, as examples), and many have seen better days. Some of the best-performing Garmin EIS fuel quantity interfaces we’ve seen have been the result of upgrading the analog senders to new CIES (www.ciescorp.net) digital senders. These have been the standard in a huge variety of new aircraft and thanks to digital signal outputs, have proven to be more accurate than even the best overhauled analog ones.
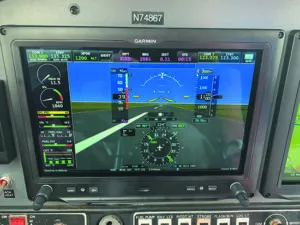
“During many Garmin EIS installations, we add the CIES digital fuel sending units and while they add a few more labor hours per sender—plus the calibration—they work we’ll with the Garmin system (and JP Instruments, too) and have proven accuracy,” TJ Spitzmiller at Sarasota Avionics in Florida told us.
“When we were installing the integrated G3X Touch in our Grumman Tiger (the STC airplane) we sent the original fuel senders out for overhaul and ultimately replaced them with digital CIES senders, which easily outperformed the rebuilt ones,” said one Garmin engineer when we flew a newly installed EIS-equipped G3X Touch at Garmin’s flight ops center in Kansas. Still, others attest to success after having some existing senders overhauled. We would commit to upgrading them, especially with a project that’s as sizable as a Garmin EIS with new displays. Go all in.
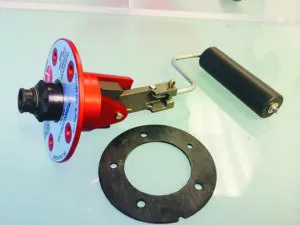
Regardless of whether the shop uses the old senders, sends them out for overhaul or repair or shotguns them for new digital senders, expect a big job with a lot of critical calibration at the end. We wrote about digital fuel quantity installations in the August 2019 issue of Aviation Consumer and it’s worth a read if you are considering any fuel quantity system upgrade.
G3X TOUCH AND GI 275
As we said, the EIS hardware and general interfacing is the same for these as it is in a TXi retrofit. But there are limitations to be aware of should you decide to use the displays in these systems. First, the G3X Touch.
The EIS is approved as the primary engine and fuel data system when installed with a base 7-inch G3X Touch MFD (without a PFD) in the portrait configuration. For a four-cylinder interface it’s $10,795 and $11,095 for six-cylinder engines. But more common interfaces with the EIS include the 10.6-inch landscape display, priced at $12,795 for a four-cylinder. Add the 7-inch portrait display to the mix for use as a primary EIS display (and as an MFD) and the price jumps to $18,020 for the package.
But not all display interfaces are created equal. For instance, the dual 7-inch portrait display option supports the EIS interface, but the engine data doesn’t present on the PFD—only on the second display, which serves as an MFD. For space-deprived panels, it may be the only option. Talk this out with your installer ahead of time so you know how the engine and fuel data will be configured. The simplest and cheapest EIS solution yet is the GI 275.
Starting at $4495, the GI 275 EIS is approved as a primary engine and fuel monitor and uses the GEA 110 remote engine module and engine sensor kits just as the other Garmin displays do. To review, the GI 275 is intended as a drop-in replacement for mechanical round-gauge instruments without having to cut metal or even the plastic overlay that may still be on older instrument panels.
But the common misunderstanding is that any GI 275 can function as an EIS. While the hardware may be the same, the software isn’t. This means that a GI 275 configured as a primary attitude instrument or electronic HSI/DG can’t function as an EIS. Moreover, Garmin’s target audience for the GI 275 is buyers who want to replace each individual round-gauge instrument with GI 275s—one of which might have EIS functionality. Think standalone engine and fuel monitor. And as such, it packs a big punch in a small chassis, including the Lean Assist, calculated percent power and exceedances alerting. We’ve covered the GI 275 extensively (see the IFR On a Budget article in the May 2020 Aviation Consumer).
Worth mentioning is that all EIS interfaces have data logging and stream engine and fuel data to the Garmin Pilot app. When you land, stored EIS data is automatically sent to FlyGarmin for cloud storage.
SHOP TIME
Expect a lot of it. Shops we talked with said typical six-cylinder EIS installs with straightforward display interfaces generally take around 70 hours of labor. Flagship TXi EIS (and G3X Touch) installs could easily top $35,000, while simpler GI 275 EIS interfaces might run $12,000 when replacing the fuel senders.
That’s a lot of dough, but a big shot in the arm for aging aircraft with old engine and fuel gauges.

