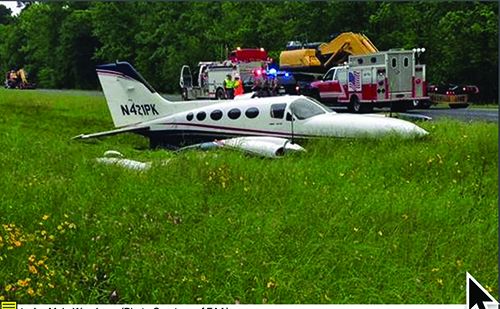
Engine failures are the stuff of nightmares. Maybe not quite so agita-inducing as your mechanic calling with a compression report, but worrisome nonetheless, even if aircraft engines are designed with reliability in mind.
So are they reliable? Well, yes, if you let them be by slaking them with gas and oil, following the procedures written right down there in the POH and avoiding the maintenance blunders that cause a surprising number of engines to fail in flight.
Mechanical failure persistently accounts for about 15 percent of all crashes in general aviation, but not all mechanicals are engine related. Let’s put the standard risk metric on it. In 2016—the most recent year for which we have complete data—engine-related accidents amounted to 0.21 accidents per 100,000 flight hours, which is about 25 times lower than the overall accident rate. And considering that up to half of all engine failures are avoidable human-induced calamities, the risk could be even lower than that. But to avoid doing the stupid stuff, you have to know what the stupid stuff is and that’s what we’re covering here.
HOW WE DID THIS
We reviewed six years’ worth of NTSB accident data, culling the engine failure accidents. We examined 2001 to 2002 and 2014 to 2016 to see if any trends had changed. Some caveats. Not all engine failures get into the accident database because not all of them lead to accidents. Even some that do end in crashes aren’t recorded. So the data we used is the best available, if compromised.
Also, as is illustrated in the graphics, a large percentage of engine failures have an unknown cause, leading to some doubt if the engine failed at all. We’re taking the report data at face value here. Last, we used the FAA’s aircraft registration database to estimate engine population by type. This is a moving target since engine population changes by year, but we couldn’t accurately sort the data by yearly change. Its accuracy is further diminished by inconsistent model nomenclature and coding. Again, we’re using the best-available data.
C vs L
Our data sweep included only U.S. accidents and although we focused on Continental and Lycoming because they’re the big gorillas, we looked at everything else, too, including turbines. The review turns up a surprisingly large number of engines that aren’t Continental or Lycoming. Nonetheless, according to FAA data, Lycoming has a slight edge on engine population, about 96,000 for Lycoming, compared to 88,000 for Continental. Continental seems to own the large-displacement market. There are more O-520s and O-550s than there are O-540s. Lycoming is dominant in the mid-horsepower segment with its ever-popular O-320 and O-360 middleweights, a market slice where Continental never competed effectively. Thanks to a swarm of Cessna 150s still flying, Continental has strong presence in the small displacement end with the O-200.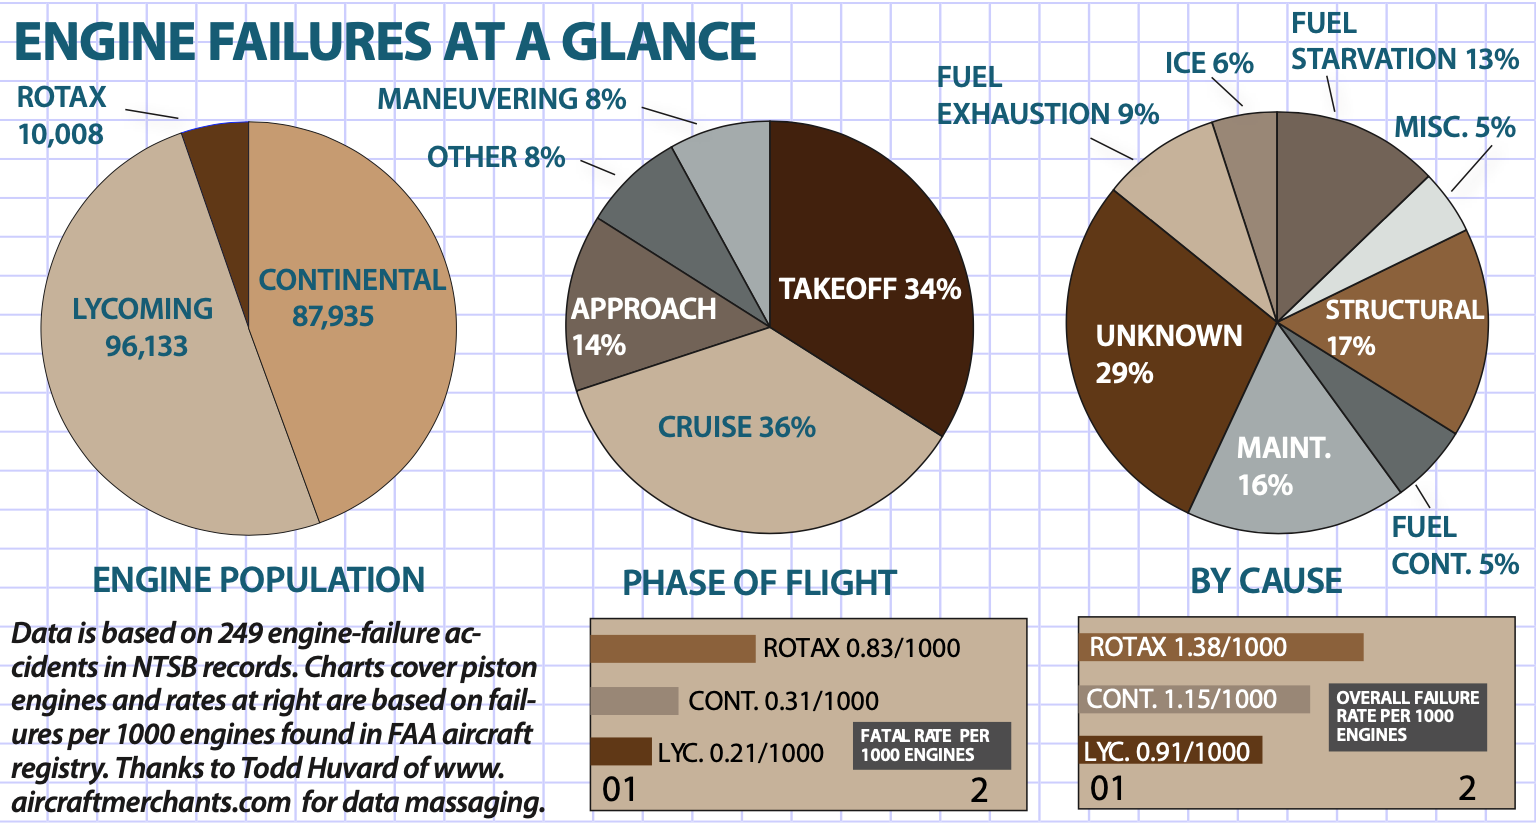
The top-line look at engine failures reveals a measurable disparity between Lycoming and Continental. On a failure rate per 1000 engines, our data shows that Continental has an overall rate of 1.15 failures per 1000 engines compared to 0.91/1000 for Lycoming. So even though Lycoming has more engines flying, the failure rate is lower than that for Continental. We have a theory to explain this.
Large-displacement high-output engines fail at a higher rate than do their smaller displacement brethren. And because Continental has more of those in the field—twice as many, it turns out—it may have more exposure and thus more failures.
For both brands, large-displacement engines are overrepresented in the failure data. For Continental, for instance, 46 percent of its engines are large displacement, but these represent 60 percent of the failures. For Lycoming, it’s 15 and 25 percent, respectively. (For reference, we used 400 cubic inches as the cutoff; Continental has a lot of O-470s flying and while Lycoming has the O-435, you’ve probably never heard of it, since it was mostly a helicopter engine.)
Increasingly, Rotax is a player in the U.S. market, although its share is a fraction of the two majors. Rotax has more than 10,000 engines on the registry, but only about a third of those were the 912 and 914 four-cylinders we were interested in. Based on our data, the overall Rotax failure rate is 1.38/1000. And here a warning about small numbers; an accident or two can sway the rate substantially. Rotax hasn’t had many accidents, but it fields a smaller number of engines, too.
WHERE THEY HAPPEN
Accepted wisdom once had it that most power failures happen at the first power change after takeoff. This was long ago debunked, but there’s still truth to it. Our survey found that a third of power failures occur during or shortly after takeoff. Slightly more happen during cruise, which makes sense since you spend more time doing that than taking off or landing.
A power failure in either phase of flight is likely to be equally fatal; 30 percent end in fatalities. The fatal probability is lower for approach-phase engine failures and we have a theory on that, too.
We don’t have any data on how many multi-engine pilots take care of business and return to the airport after an engine tanks because these may be rarely reported. We do know from the accident reports that many engine failures in twins live up to the black joke about the second engine getting the airplane to the scene of the crash.
A few of these are spectacular VMC rollovers, but more are simply crashes into trees, terrain or airport fences because on a good day, light and medium twins can barely climb on one engine and losing one is the definition of a bad day. Fuel mismanagement also surfaces as a problem in twins.
For both Continental and Lycoming, single-engine failures are more survivable than twin-engine failures by a wide margin. For both Lycoming and Continental, engine failures in twins are twice as likely to be fatal as a failure in a single-engine airplane. That said, engine failures in single-engine airplanes all too often result in a stall, mush, spin or other loss of control.
Now the theory: Failures during approaches or descents typically happen at higher airspeeds and lower angles of attack, giving the pilot more options to respond. On takeoff, speeds are typically slow at Data is based on 249 engine-failure accidents in NTSB records. Charts cover piston engines and rates at right are based on failures per 1000 engines found in FAA aircraft registry. Thanks to Todd Huvard of www.aircraftmerchants.com for data massaging.
high AoA and many pilots struggle to pitch the nose over to avoid a stall or spin.
WHY THEY HAPPEN
If there’s anything scandalous about our findings it would be how many engine-failure accidents are of unknown causes. The NSTB reports show that 30 percent of engine failures that led to accidents have no known cause. In the Lycoming data, it’s far worse: 41 percent were listed as cause unknown.
In our view, the NTSB investigations are uneven in their detail and thoroughness and in many cases, the agency doesn’t send an investigator but relies on the FAA to complete the accident probe. In a podcast interview for our sister publication, www.avweb.com, NTSB vice-chairman Bruce Landsberg said that engine investigations are a weak point.
“It’s our largest uncleared area. All of the regional investigators are signed up to go the Transportation Safety Institute in Oklahoma City for an in-depth program on recip engine design, construction and failure points and what to look for after a crash. We know we had a weakness there and we are finally doing something about it,” Landsberg said.
From what investigatory data is available, some patterns are discernible. First, more than a quarter (27 percent) of engine-failure crashes are caused by preventable fuel problems: exhaustion, mismanagement or contamination. Misfueling comes up, but it’s rare.
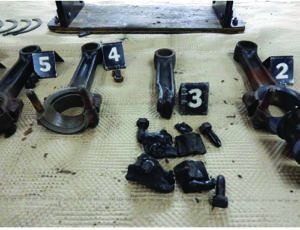
Less rare are bona fide structural failures in which something serious breaks—a connecting rod, a crank, a valve or camshaft. Structural failures account for 17 percent of the engine failures we examined, with more of them happening in Continental than in Lycoming engines.
Occasionally, the engines get a little help from inept mechanics. In 11 percent of the failures, errors by maintainers were cited. Under-torquing of fasteners—cylinder through bolts, rod nuts, fuel pumps, accessory case hardware—are some examples. In fact, several of the catastrophic failures we found consisted of spun main bearings that damaged crankshafts or connecting rods because of improper torquing following cylinder removal and related work.
Although this trend doesn’t appear to be epidemic, it has been noticed by Savvy Aviation’s Mike Busch, whose owner advisory service tracks hundreds of aircraft in the field. He recommends not torque-relieving more than one pair of through bolts at one time and not rotating the crankshaft when the work is done. Continental engines are particularly susceptible.
“The rod bolts are the most highly stressed fasteners in the engine, and getting the proper preload on them is absolutely crucial. Most Lycoming rod bolts are torqued to stretch using a micrometer, so their preload is usually pretty accurate. Continental engines, however, have their rod bolts tightened using the torque method, which is fraught with peril and very difficult to perform correctly when the case isn’t split, especially with access from only one side of the engine,” Busch told us in an email.
TAKEAWAYS
While the risk of an engine failure is relatively low, it can be reduced by heeding patterns we see in the accident reports. Carrying enough fuel should be a no-brainer, as is religiously checking it for contamination before flight. If you’re obsessive, let the tanks settle for 15 minutes before sumping them after adding fuel. In our survey, we found 25 accidents in which pilots crashed perfectly airworthy airplanes with usable fuel in tanks that they couldn’t figure out how to access. At least three of these led to dual engine failures in twins and two were major fatal accidents killing all aboard simply because of the pilot’s ignorance of the fuel system. Single-engine airplanes aren’t immune. Fifteen of the 25 fuel starvation accidents occurred in singles, which typically have simpler fuel systems. Induction icing doesn’t loom large as an accident cause, but it too is avoidable. In a dozen wrecks, pilots lost the engine because they forgot to use carburetor heat at reduced power settings or when descending. Continental’s O-200 and O-470 are especially susceptible to carb icing. In fuel-injected engines, know where the alternate air source control is and when to use it.
Avoiding maintenance-induced stoppages is more difficult. You hire an A&P because he’s supposed to know how to fix the engine and let’s be fair here and say that the vast majority are competent at the job. But enough mistakes are made to reveal a discernible pattern of errors that caused more than 20 engines to quit. In our view, that’s not a trivial risk. Deferred maintenance has caused a handful of accidents, including failing to replace aged-out hoses or questionable fittings and failing to do required magneto maintenance. That said, if maintained, magnetos appear to be as reliable as reputed, and were cited only twice as a cause of engine-failure accidents.
Training figures into this, in our view, less for twins than singles. Preparing to respond to an engine failure after takeoff and in cruise should be a routine part of every pilot’s recurrent training, not just on a 24-month flight review. Stall/spins in these situations are all too common. The challenge for twin-engine pilots is different by degree and it’s not just going through the fire drill of identifying and caging the bad engine, but accepting that the airplane won’t actually climb on one engine and making the best of putting it on the ground somewhere. At least two pilots—one a designated examiner seizing control of the airplane from an applicant—did exactly this and lived to fly another day. It’s a lesson we should all take to heart.

